19 February 2010
The RNR Census 2009, re leased recently, paints a com prehensive picture of use and sale of natural resources.
The census, which collect ed data from 57,412 (93.2 percent) of households that engaged in agricultural farming activities across 205 ge wogs and extended municipal areas in 20 dzongkhags, was conducted for the production year 2008.
Findings
The study showed a 14 per cent decrease in agricultural land area. Compared to 2000 data, wetland decreased by 11 percent and dry land, by 17 percent. However, cash crop land increased by 12.1 percent.
However, upon completion of the ongoing nationwide ca dastral land survey and grant ing of land kidu, the agricul tural land area is expected to change drastically.
Twenty-three percent of agriculture land had been left fallow mainly on account of crop damage by wild animals which accounted for 36.07 percent.
Maize accounted for the largest amount (69.38 per cent) of cereal grains de stroyed by wild animals fol lowed by rice (27.39 percent). Wild boar was responsible for destroying 63.34 percent of the cereal grains. About 6.16 percent of the cereal cultivat ed area was affected by wild animals with corresponding production loss estimated at 3.26 percent.
In 2008, about 55.74 per cent of the rural households was affected by crop damage by wild animals and 30.61 percent of households faced insufficient irrigation water. Limited access to market, pests and diseases, and land shortage were other con straints.
In the same year, wild animals killed 2,205 cattle, 499 yaks, 204 horses, 1,488 sheep, 180 goats, 41 pigs and 2,316 chickens.
According to the study, the population of yak had in creased by 15.9 percent and that of goats by 9.1 percent. There was a drastic decrease in the population of pigs, sheep, horses, and poultry by 54.1 percent, 47 percent, 19.9 percent and 14.3 per cent respectively.
The households mostly owned cattle (310,071), yaks (40,482), poultry (197,766), horses (22,335) and pigs (18,963). About 14 percent of the households owned cats and six percent, dogs.
The study did not reveal much difference in diary pro duction but there was a dras tic decrease in quantity of all kinds of meat.
According to the study, farm mechanisation had greatly improved. However, in terms of land cultivation, about 88.10 percent of the households still used oxen, 7.43 percent used power til ler and other farm machinery, and 0.98 percent dug the land manually.
For 59.4 percent of the households, horticulture crops are the main sources of cash income followed by livestock products for 33.6 per cent of households and off-farm activities for 32 percent of households. However, for Gasa Dzongkhag, the main cash income for 56.7 percent of households is livestock products, for 37.4 percent it is use of yaks and horses for transport, and for 30.7 per cent it is non-wood forest products.
Despite many constraints, production was not bad. 2008 produced 52,959.4 metric tonnes (MT) of po tatoes, 7,312.5 MT of chil lies, 3,459.2 MT of beans and 3,578.8 MT of mustard. Among the cash crops, the biggest produce was 38,183.8 MT of mandarin followed by 5,410.4 MT of apple and 961 MT of peach.
In forestry sector, at least 89.76 percent of the house holds were reported to be aware of the forestry rules. About 79.48 percent of the households were of the opin ion that the coming of elec tricity would reduce pressure on the forest resources.
A total of Nu 2,045.75 mil lion was generated from the sale of cereal grains followed by horticulture crops (78.55 percent), livestock products (14.90 percent) and forest products and byproducts (6.55 percent).
A total of Nu 866.13 million was spent on the purchase of food commodities such as grains (36.64 percent), dairy products (14.5 percent), eggs (0.85 percent), fish (4.76 per cent), meat (17.79 percent), cooking oil (16.17 percent), sugar (0.78 percent) and veg etables and others (8.51 per cent).
The study showed that since 2000, the number of agricultural households in creased by 1.7 percent and total number of households enumerated increased by 5.4 percent.
The proportion of rural households within less than one hour’s walking distance to road points has increased to 53 percent and within six hours walking distance to 90 percent from 40.2 percent and 83.5 percent respectively in 2000.
The expenditure in some dzongkhags outstrips income, which indicates that the pro duction in general is low.
Dzongkhag Income Expenditure
Thimphu 52.83 47.55
Paro 114.36 103.34
Haa 28.97 31.01
Chukha 90.01 58.96
Samtse 99.82 87.02
Punakha 79.89 48.63
Gasa 19.07 14.71
Wangdiphodrang 169.18 48.11
Tsirang 37.40 39.16
Dagana 36.83 39.53
Bumthang 57.82 35.01
Trongsa 25.03 12.44
Zhemgang 19.87 13.67
Sarpang 39.57 58.99
Lhuentse 20.81 16.89
Monger 77.27 43.06
Trashignag 87.83 64.13
Trashiyangtse 38.18 27.69
Pemagatshel 27.52 39.85
Samdrupjongkhar 48.93 36.34
By Sonam Pelden & Namgay Tshering
Bhutan observer
The Sorry Saga of Bhutan's North
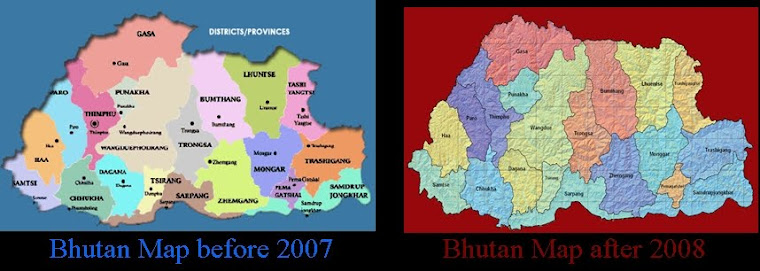
Click over the map to know the differences
No comments:
Post a Comment